Figures from PropertyData show that commercial property transactions slowed to just 89 in August, compared to 232 transactions a year earlier. Meanwhile, the Savills average prime yield remained static at 5.23%, maintaining the highest level since September 2013. Total investment volumes for the year have now reached £23.1bn. To attain the long-term average volume of £44.9bn, capital invested would need to almost double.
The alternatives sector has been the only segment to see a rise in annual investment volumes between January and the end of August, with the primary driver being Blackstone’s purchase of the iQ Student accommodation portfolio for £4.7bn.
There has also been a significant increase in demand for warehouse space, reaching 30.2m sq. ft, while the supply picture remains healthy. Vacancy levels sit at 6.5%, considerably below the 12% needed for rental growth to falter. Looking at logistics investment volumes, the three-year rolling average reached £9.1bn, its highest-ever level, this can be attributed to the continued rise in online retail levels, prompting an increase in the amount of warehouse space required. Online retail now accounts for around 30% of all retail sales. If the current level of online retail is maintained over the coming year, an additional 14.9m sq. ft of warehouse space will be needed.
The pandemic has led to a surge of interest in online grocery shopping and investors are bidding up prices on large UK supermarket sites as a result. According to Colliers, more than £1bn of transactions involving supermarket sites have completed this year compared to last year’s £1.8bn – although this was boosted by the £429m sale of a portfolio of Sainsbury’s stores owned by British Land.
Interest has increased from investors after large supermarket chains started using their extra space to meet rising online orders. Online grocery shopping has jumped from 7% of the total market to more than 13%, according to market researcher Kantar, with the proportion even higher at both Tesco and Sainsbury’s. Additionally, lockdown has resulted in more households limiting their trips to the supermarket and reverting back to the weekly shop. Traditional supermarkets with large car parks, plenty of choice and ample room for social distancing have seen the greatest benefit.
Over the last few months as offices reopened up and down the country, returning to normality has not been straightforward. According to Knight Frank, in the immediate term, employees will be allowed back into the office on a permission-only basis. Physical distancing will be essential, while ‘human transit routes’ will be outlined in office buildings to ensure employees stay apart.
The experiences of the pandemic are likely to have a lasting impact on how and where we work. Working from home has proved to be effective for many businesses and this may continue to be the case moving forward. It’s likely that a ‘hybrid model’, where some people work from home and others work from the office, will become a regular part of working life. This may result in a reduced demand for office space, but most firms recognise that business culture depends on the interaction and collaboration provided by offices.
| There has also been a significant increase in demand for warehouse space, reaching 30.2m sq. ft, while the supply picture remains healthy |
Source: Zoopla, data extracted 21 September 2020
| Region | No. properties | AVG. asking price |
|---|---|---|
| London | 1,157 | £1,091,159 |
| South East England | 1,249 | £634,835 |
| East Midlands | 860 | £536,817 |
| East of England | 757 | £473,875 |
| North East England | 928 | £311,435 |
| North West England | 1,754 | £418,343 |
| South West England | 1,782 | £648,679 |
| West Midlands | 1,235 | £601,042 |
| Yorkshire and The Humber | 1,327 | £375,593 |
| Isle of Man | 52 | £479,025 |
| Scotland | 1,340 | £269,394 |
| Wales | 813 | £384,100 |
| Northern Ireland | 32 | £438,752 |

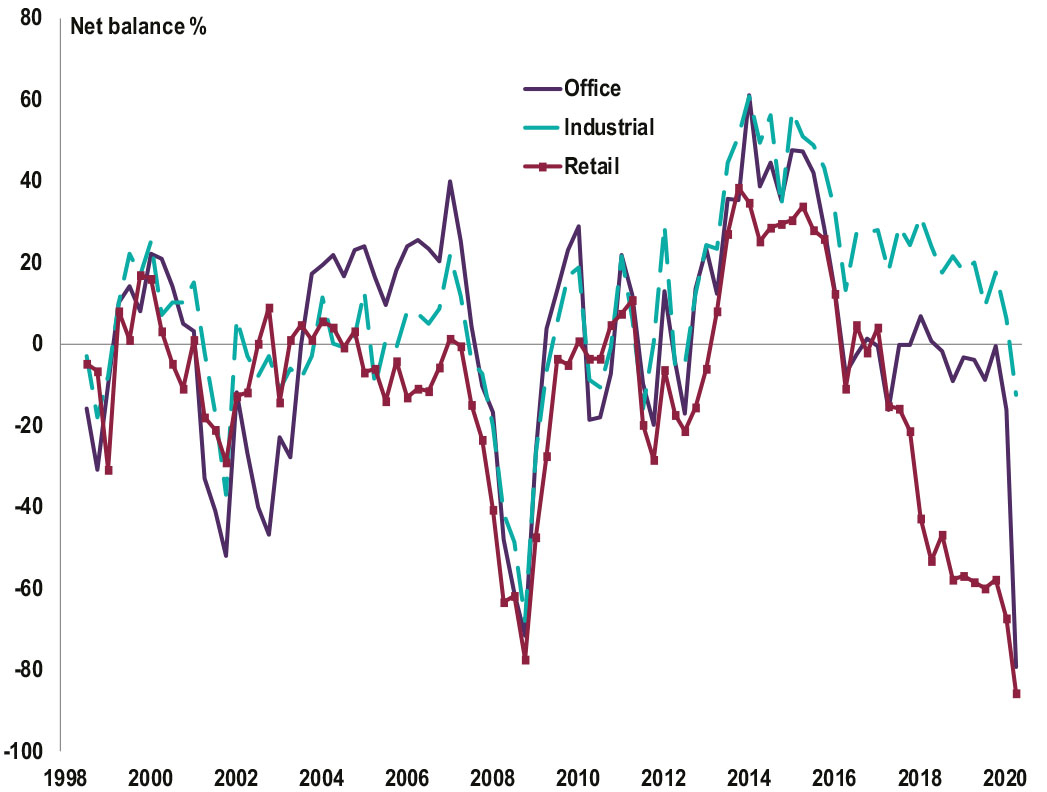
Source: RICS, UK Commercial Property Market Survey, Q2 2020

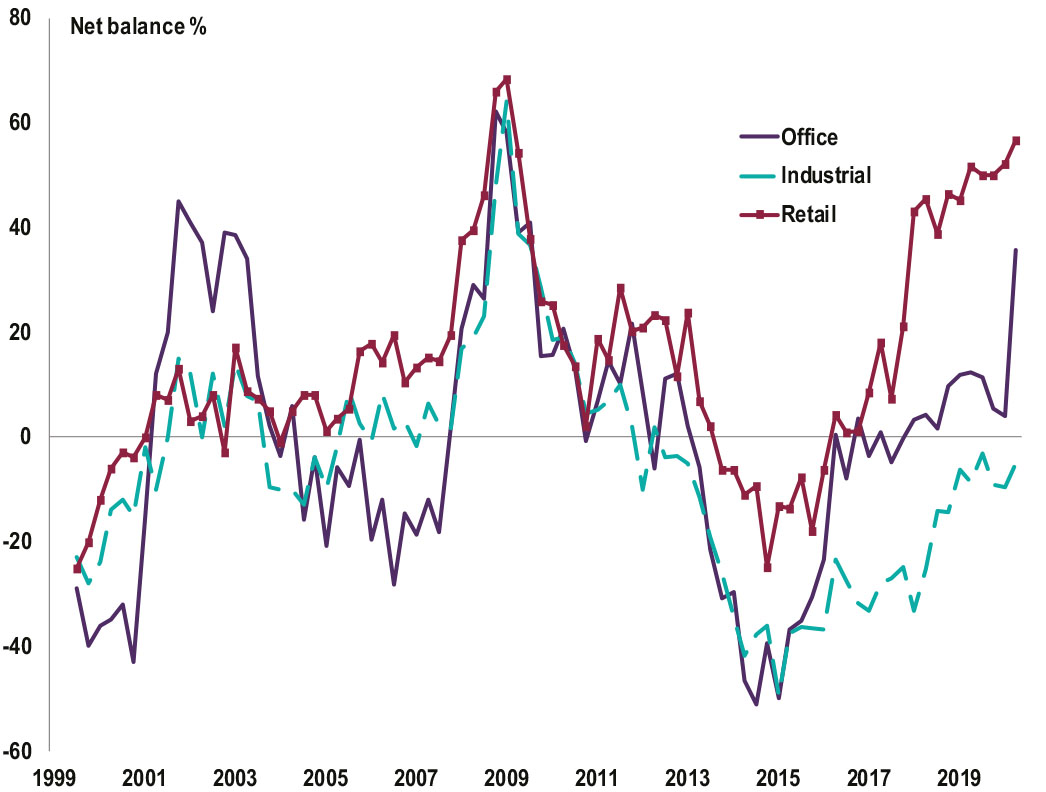
Source: RICS, UK Commercial Property Market Survey, Q2 2020
All details are correct at the time of writing (21 September 2020)
It is important to take professional advice before making any decision relating to your personal finances. Information within this document is based on our current understanding and can be subject to change without notice and the accuracy and completeness of the information cannot be guaranteed. It does not provide individual tailored investment advice and is for guidance only. Some rules may vary in different parts of the UK. We cannot assume legal liability for any errors or omissions it might contain. Levels and bases of, and reliefs from, taxation are those currently applying or proposed and are subject to change; their value depends on the individual circumstances of the investor. No part of this document may be reproduced in any manner without prior permission.